


Solana (CRYPTO: SOL) is up over 2% on Monday, with an AI-based forecast highlighting a decisive breakout test around the $240 resistance zone.
AI Forecast Signals Key Test
The AI was asked to provide a short-term analysis for Solana and returned $227 as the key support and $240–$242 as the immediate resistance zone.
A breakout from this area would confirm continuation of the bullish channel that has been intact since mid-summer, opening a path toward $253 and possibly $265 in extension.
On the downside, the forecast suggests $227 remains the critical near-term support.
A failure to hold above this level could drag Solana back toward the 50-day EMA at $213.
Technical Indicators Point To Bullish Pressure
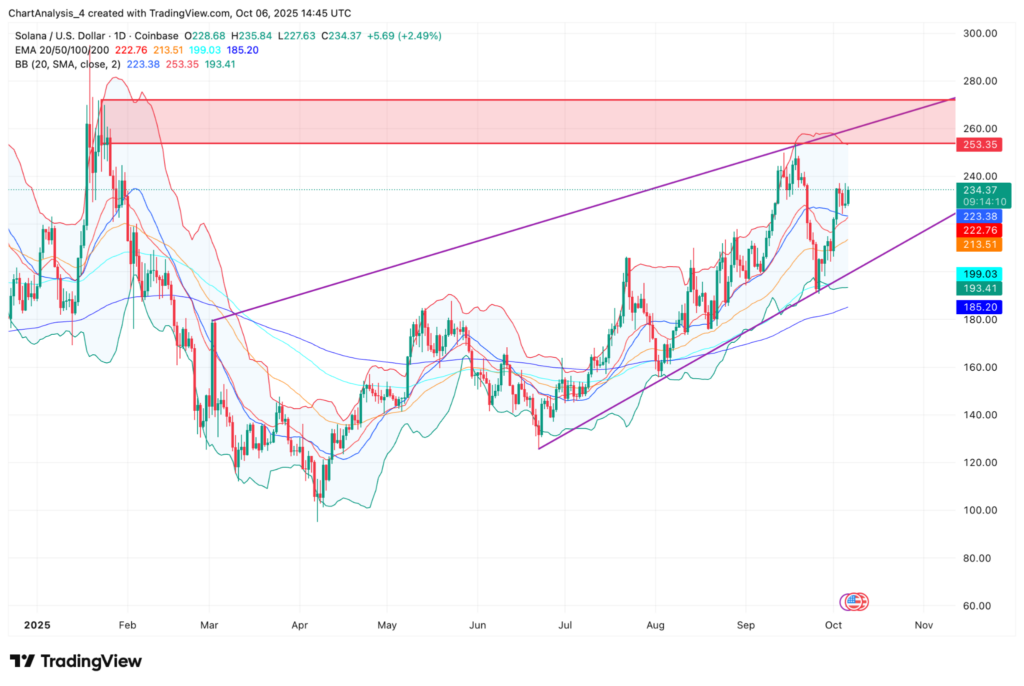
SOL Technical Analysis (Source: TradingView)
Solana continues to trade above all major moving averages, with the 20-day EMA at $222 and the 50-day EMA at $213 acting as immediate support layers.
The 100-day and 200-day EMAs, clustered around $199 and $185, reinforce the longer-term base.
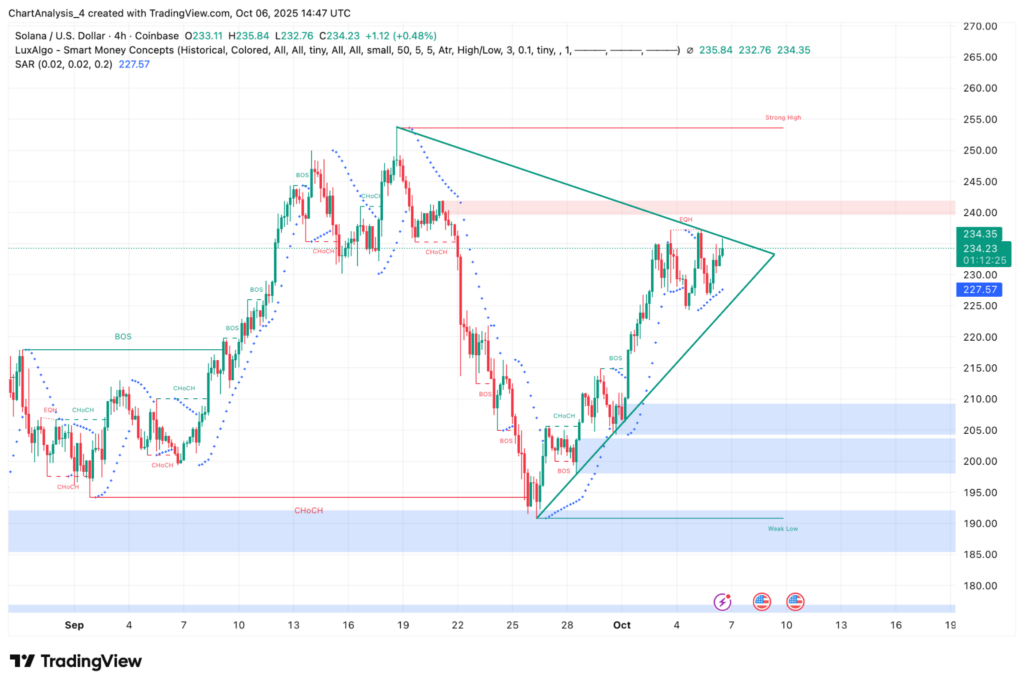
SOL AI-Based Forecast (Source: TradingView)
Bollinger Bands show price riding the mid-to-upper band range, while the Parabolic SAR remains below price, underscoring short-term bullish pressure.
Smart Money Concepts (SMC) analysis highlights a tightening symmetrical triangle, with higher lows at $227–$230 and repeated rejections near $240.
Traders Position Ahead Of A Breakout
Traders have been closely tracking Solana's narrowing structure, with positioning suggesting anticipation of an imminent move.
A decisive break above $240 would likely trigger momentum buying, while rejection could extend consolidation within the $227–$240 range.
The weekly bias remains bullish as long as price holds above $227, though neutral-to-bearish sentiment may re-emerge if support fails.
Read Next:
- Strategy Rewrites Corporate Playbook With $3.9B Bitcoin Gain--MSTR To Break Out?
Image: Shutterstock